For rental investors

Real Estate Investment Report
What to Include, With a Worked Example

A partner, a lender or your own future self will ask the same questions about a rental: what did it cost, what does it earn and is it worth the money. A one-page investment report answers them. Here is what goes in it and a worked report for a $300,000 rental.

The seven sections of an investment report

  1. Property. Address, type, units, year built and condition.
  2. Purchase and financing. Price, closing costs, down payment, loan amount, rate, term and monthly payment.
  3. Income. Rent per unit, other income and a vacancy allowance.
  4. Operating expenses. Property tax, insurance, maintenance, management, utilities and HOA. Mortgage payments are not operating expenses.
  5. Results. NOI, debt service and cash flow, by month and by year.
  6. Returns. Cap rate (NOI over price), cash-on-cash return (cash flow over cash invested) and DSCR (NOI over debt service).
  7. Assumptions and risks. Where each number came from, and what would change the answer: a vacancy, a rate reset, a big repair.

If you mean market reports, the city and national figures from data firms, those are a different document. SealedFolio's real estate investing statistics page collects the main national numbers, and they belong in section 7 as assumptions.

Worked example: a $300,000 single-family rental

Bought for $300,000 with 20% down ($60,000) and $9,000 of closing costs, so $69,000 of cash in. The $240,000 loan is at 6.5% over 30 years, a payment of $1,517 a month. Rent is $2,520 a month and the owner self-manages.

LinePer yearHow it is worked out
Gross rent$30,240$2,520 times 12
Vacancy allowance-$1,5125% of gross rent
Effective income$28,728Gross rent minus vacancy
Property tax-$3,600From the tax bill
Insurance-$1,500From the policy
Maintenance-$2,4198% of gross rent
NOI$21,209Effective income minus operating expenses
Debt service-$18,204$1,517 times 12
Cash flow$3,005NOI minus debt service, about $250 a month
Cap rate7.07%$21,209 divided by $300,000
Cash-on-cash return4.36%$3,005 divided by $69,000
DSCR1.17$21,209 divided by $18,204
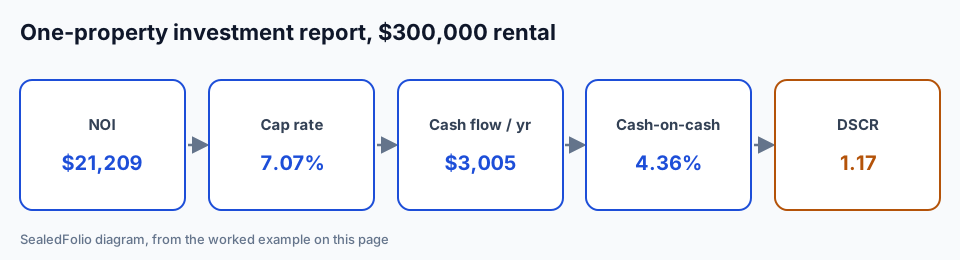
Diagram of a one-property investment report for a 300,000 dollar rental: NOI of 21,209 dollars, cap rate 7.07 percent, annual cash flow 3,005 dollars, cash-on-cash return 4.36 percent and DSCR 1.17
One-property investment report. Diagram by SealedFolio.

Reading the report: the 7.07% cap rate is healthy, but the 6.5% loan takes most of it, so cash-on-cash is only 4.36%. The DSCR of 1.17 is below the 1.20 to 1.25 many lenders look for on a DSCR loan, so this deal would need more down or more rent to refinance on rental income alone.

To rerun these numbers with your own figures, use the rental ROI calculator, the cap rate calculator and the cash-on-cash return calculator.

Pro forma or actual: which report you are writing

Before you buy, the report is a pro forma: every number is an estimate. After a year of ownership, write it again from actual figures. The gap between the two is the most useful thing in either report, because it shows which assumptions were wrong. Maintenance and vacancy are usually the ones that miss.

For a portfolio, add a schedule of every property with its value, loan balance, NOI, DSCR and LTV. Lenders call that a schedule of real estate owned and ask for it at every new loan.

Where SealedFolio fits

SealedFolio builds the actual-figures version of this report from your own books. Every paid plan has an income statement, cash flow by month and the rent roll per property, plus ROI tools for the purchase-stage numbers. The Portfolio plan adds the schedule of real estate owned with value, debt, NOI, DSCR and LTV for each property. Property values are the ones you enter; SealedFolio does not estimate market value.

Everything stays in an encrypted vault on your own Mac or Windows PC. For more on running a portfolio with it, see SealedFolio for real estate investors.

Investment reports from your real numbers

SealedFolio Pro is $19 a month or $179 a year for up to 3 properties. Portfolio is $39 a month or $297 a year for unlimited properties. Both come with a 30-day money-back guarantee.

See SealedFolio pricing

Real estate investment report: frequently asked questions

What is a real estate investment report?

A short document that sets out a property's price and financing, its income and expenses, the resulting NOI and cash flow, and the return measures an investor, partner or lender uses to judge it: cap rate, cash-on-cash return and DSCR.

What should a rental property investment report include?

Property details, purchase price and closing costs, the loan, rent and vacancy, each operating expense, NOI, debt service, cash flow, cap rate, cash-on-cash return, DSCR and the main risks. A portfolio report adds a schedule of every property with its value, debt and income.

Is a real estate investment report the same as a market report?

No. Market reports from data firms cover prices, rents and sales across a city or the country. An investment report is about one property or one owner's portfolio. Both are useful, and market figures can go in the assumptions section of an investment report.

Can SealedFolio produce an investment report?

It produces the pieces from your real books: an income statement and cash flow by month per property, the rent roll and, on the Portfolio plan, a schedule of real estate owned with value, debt, NOI, DSCR and LTV for each property. Its ROI tools and the free calculators on this site cover the purchase-stage numbers.